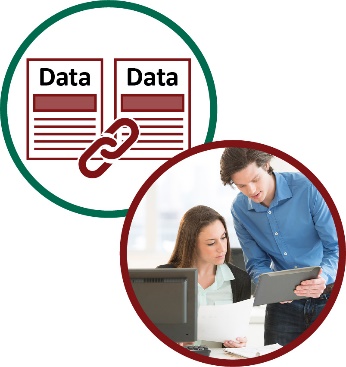
Testing different ways of getting data
| Each test case looked at different ways to:
|
| This means we can work out how to link data we have now in better ways. |
| We faced some challenges when we got different data from each test case. |
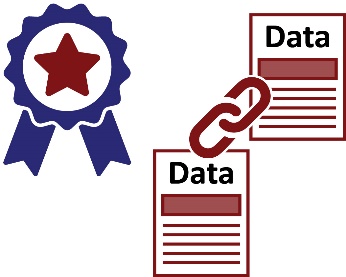
| One of these challenges was how well our technology worked to:
|
| This means we will need to make our technology better so it can handle lots of data. |
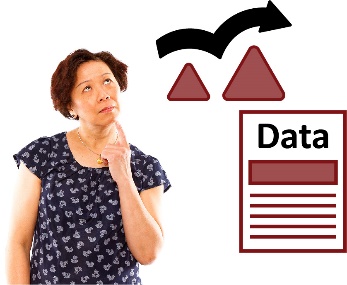
| Using all types of data about people with disability helps us understand all people with disability. |
| Each test case used a different way to tell if someone was a person with disability. |
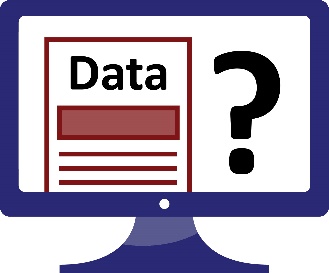
| This means we could look at the different ways to tell if someone was a person with disability and see what:
|


Testing different ways of getting data
| Each test case looked at different ways to:
|
| This means we can work out how to link data we have now in better ways. |
| We faced some challenges when we got different data from each test case. |
| One of these challenges was how well our technology worked to:
|
| This means we will need to make our technology better so it can handle lots of data. |
| Using all types of data about people with disability helps us understand all people with disability. |
| Each test case used a different way to tell if someone was a person with disability. |
| This means we could look at the different ways to tell if someone was a person with disability and see what:
|